.png)
GANN Intraday Reversal Time Calculator
"Trade with precision - Gann-based intraday reversal calculations. Unlock the power of time and price for accurate intraday turnarounds."
Notice Board for Our Family ❤ & Loyal user ............👇👇 All Important Updates will be shown here


"Take your intraday trading to the next level with the power of Gann Calculator - Our Intraday Reversal time calculator revolutionizes your trading with unmatched precision. Utilizing advanced algorithms and historical price data, it identifies potential trend reversals with razor-sharp accuracy, empowering you to make informed trading decisions and stay ahead of the game in even the most volatile markets."
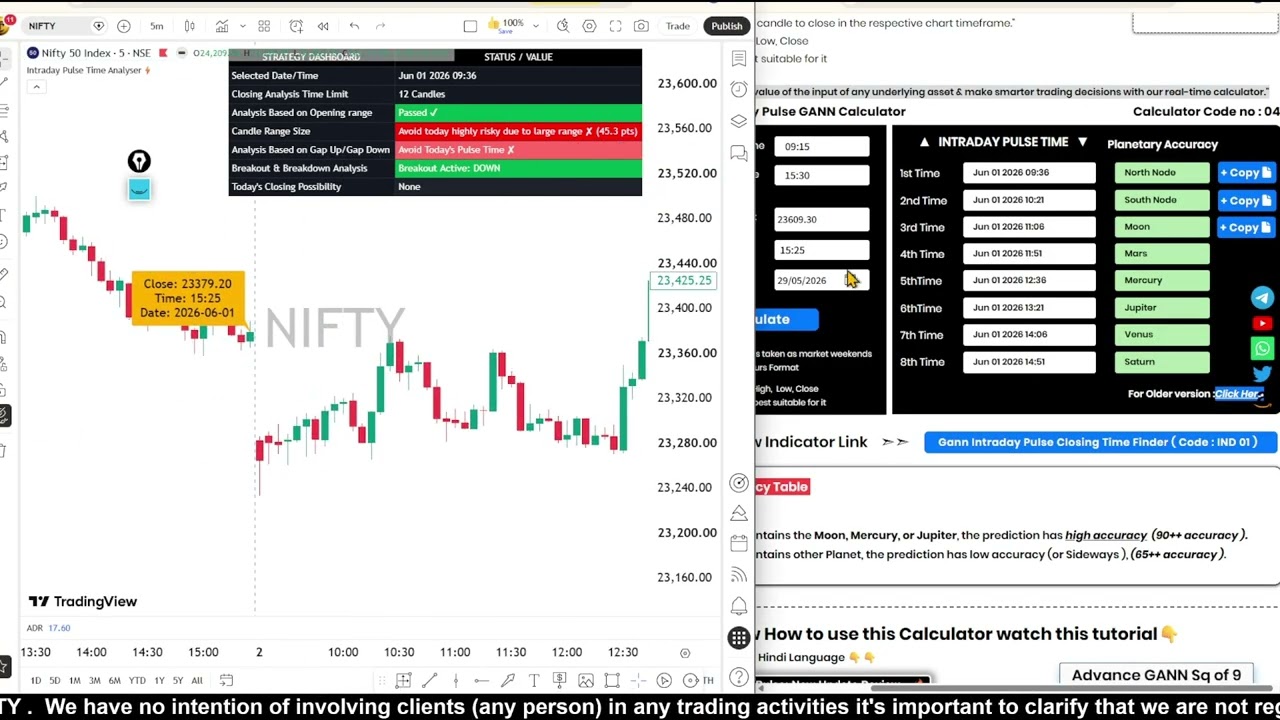
Calculator no : 01 Simple Intraday reversal time calculator
"Enter the corresponding field of any underlying asset and make smarter trading decisions with our real-time calculator."
Fixed market opening time
Fixed market closing time
Enter Important Price*
Date of that price
Enter Candle Closing Time
* Use 24Hr Time Format
Possible Reversal time A/C to GANN
1st Time
2nd Time
3rd Time
4th Time
This calculator is best suitable for Indian Markets because opening and closing time are fixed in this calculator. Important Note : ▪️1st Time is more important then other time ▪️Watch other time (like 2nd, 3rd, & so on) when 1st time have no sufficient impact on price* ▪️or when time interval is very less
Calculator no : 02 Simple Intraday reversal time calculator
"Enter the corresponding field of any underlying asset and make smarter trading decisions with our real-time calculator."
Enter market opening time
Enter market closing time
Enter Important Price*
Enter Price Date
Enter Candle Closing Time
* Use 24Hr Time Format
Possible Reversal time A/C to GANN
1st Time
2nd Time
3rd Time
4th Time
"This calculator is best suited for markets that open and close on the same day and have Saturday and Sunday as market holidays. For example: MCX, equity markets, etc." Important Note : ▪️1st Time is more important then other time ▪️Watch other time (like 2nd, 3rd, & so on) when 1st time have no sufficient impact on price* ▪️or when time interval is very less
Calculator no : 03 Simple Intraday reversal time calculator
"Enter the corresponding field of any underlying asset and make smarter trading decisions with our real-time calculator."
Enter market opening time
Lunch Break Start time
Lunch break ending time
Enter market closing time
Enter Important Price*
Enter Price Date
Enter Closing price Time
* Use 24Hr Time Format
Under Modification
Possible Reversal time A/C to GANN
1st Time
2nd Time
3rd Time
4th Time
"This calculator is best suited for those markets where there is a lunch break session between market opening and closing times on the same day, and where Saturday and Sunday are market holidays. For example, Asian markets." Important Note : ▪️1st Time is more important then other time ▪️Watch other time (like 2nd, 3rd, & so on) when 1st time have no sufficient impact on price* ▪️or when time interval is very less
Most Recent Video :


Intraday reversal time calculator by gann
Gann theory is a popular method used in technical analysis to identify potential price and time reversals in the market. Gann believed that time and price were equally important in analyzing the market and used mathematical calculations to predict future price movements. One tool commonly used in Gann theory is the Gann square, which is a grid of numbers that can be used to identify potential support and resistance levels.
To calculate intraday reversal times using Gann theory, you can use the following steps:
-
Identify the high and low of the current price trend.
-
Draw a Gann square using the high and low prices as the starting points.
-
Divide the square into smaller squares using horizontal and vertical lines.
-
Each square represents a specific time and price level. Identify the key squares that correspond to important intraday time intervals, such as the opening hour, lunch hour, and closing hour.
-
Look for potential reversal times at the intersections of key squares within each time interval. For example, if the trend retraces to a key square during the opening hour, look for potential reversal times at the intersections of that square and other key squares.
There are also many online tools and software programs that can assist with Gann-based intraday reversal time calculations, often using complex algorithms and historical price data to identify potential reversal times with greater accuracy.
Understanding the Gann Square
The Gann square is a powerful technical analysis tool used by traders who follow the Gann theory. It's based on the idea that price and time are equally important in trading analysis, and that the relationship between the two can be used to predict future price movements.
Creating a Gann Square
To create a Gann square, traders start by selecting a significant low or high point for a particular security or market. From there, they divide the price levels and time intervals into equal units, forming a grid of squares. Each square represents a specific price level and time interval, which can be used to predict potential future price movements.
Using the Gann Square in Trading
Traders use the Gann square to identify potential support and resistance levels, as well as predict future price movements and trends. The square can also help identify key turning points and potential trend reversals. Traders can use the Gann square in conjunction with other technical analysis tools to gain a more complete picture of the market and make more informed trading decisions.
Limitations of the Gann Square
While the Gann square can be a powerful tool in the hands of an experienced trader, it's important to remember that it's not foolproof. Like any technical analysis tool, it has its limitations and is subject to interpretation. Traders should use the Gann square as part of a larger trading strategy, rather than relying on it exclusively to make trading decisions.
Conclusion:
The Gann square or price time square is a valuable tool for traders who want to take a more precise and calculated approach to their trading decisions. By understanding the relationship between price and time, traders can make more informed decisions about when to enter and exit trades, and identify potential support and resistance levels. While the Gann square is not a guarantee of success, it can be a valuable addition to any trader's toolbox.


